Why is Visual Analytics necessary?
In the big data era, businesses must organize and use data from various sources for digital transformation and data-driven decisions.
Simply visualizing data is not enough. Businesses need to uncover hidden relationships and insights in order to understand past, present, and predict future trends.
Visual analytics simplifies complex data into intuitive visuals, allowing users to extract key insights and make informed decisions without expert knowledge.
Visual analytics can reveal a strong link between female customers in a region and ankle boots, predicting sales growth. It provides insights into future trends, enhancing strategic decisions and collaboration through visual reports and dashboards.
Visual analytics uses graphics to tell stories about the past, present, and future.
How to choose visual analytics tools?
As data-driven decision-making becomes more prevalent, IT departments are increasingly being asked for raw data, custom analysis, and one-off reports.
Decision-makers are frustrated by delays and lack of access to necessary information, while managers increasingly want information available anytime, anywhere.
Visual analytics tools should be user-friendly, allowing everyone to obtain fast results and share insights. They assist users in comprehending data and effortlessly discovering stories from graphical reports.
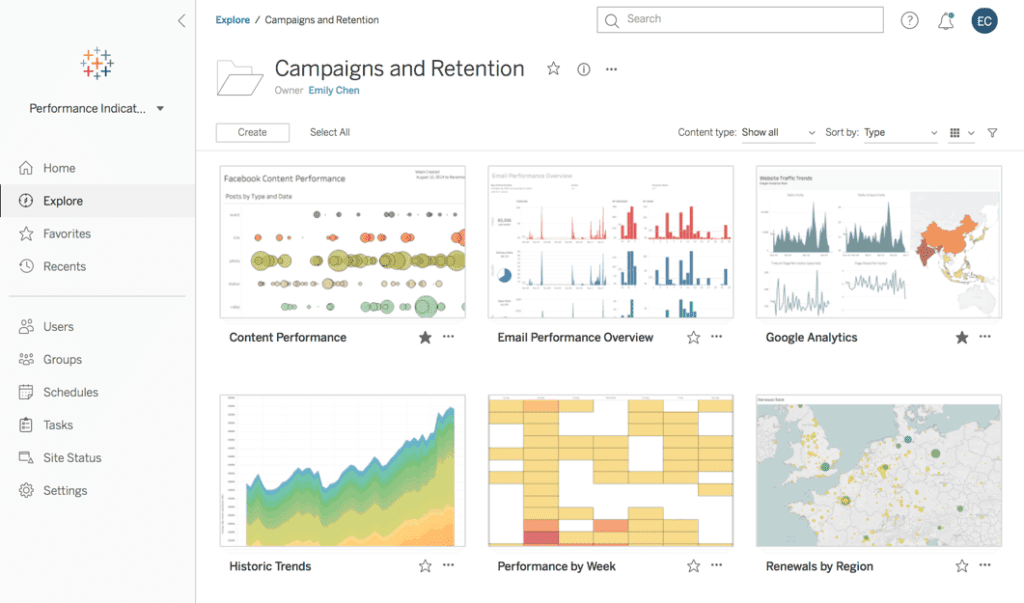
Tableau allows users to visualize and analyze data, find patterns, and share insights with optimized dashboards on different devices.
BI + Analytics = Enterprise Data Discovery
Data visualization: Helps uncover overlooked value.
Tableau simplifies the analytics process by helping businesses of all sizes and industries discover valuable insights from their data.
Streamlined analytics approach: Address challenging issues quickly.
Speeding up analytics and making data insights accessible to all is crucial. Many companies struggle with analysis due to the need for expert skills. Tableau allows anyone to gain insights from data quickly for better decision-making.
Powerful reporting capabilities: Allow users to create and share vital information.
Create and share reports instantly with Tableau, accessible on any device or embedded in applications, providing decision-makers with timely information.
BIHub: An integrated data analytics platform.
BIHub, by VisualBI, integrates Tableau and Power BI into one solution, simplifying access and search across systems.
Tableau on Exasol: A self-service analytics integration solution.
Exasol’s fast database computing enables quick and easy data analysis for Tableau users. It scales and processes queries rapidly, making real-time business data queries efficient through Tableau integration.
Tableau Visual Analytics 優點
Empower everyone with advanced analytics insights.
Users can analyze data, predict trends, test scenarios, and make decisions without coding.
Increase analytics team productivity by solving complex problems faster.
Tableau utilizes In-Memory analytics for rapid analysis, facilitating the discovery of insights in large datasets and enhancing productivity.
Promoting collaboration and information sharing.
Making data easily accessible through familiar platforms encourages participation in discussions, as long as IT ensures security and control.
Enabling self-service analytics for enterprises.
SAS Visual Analytics helps users analyze large data visually and quickly with advanced analytics and In-Memory technology. It enables fast problem-solving and discovery of hidden insights across departments, tailored for large-scale applications.
Create an appropriate analytical environment.
Deploy Tableau on-premises, distributed servers, or public clouds like Amazon and SAS Cloud, based on your organization’s needs.
Mobile BI
With Tableau, decision-makers can access reports on the go with tablets.