PostgreSQL 15 auto_explain 功能強化:讓普通帳號也能查看 SQL 執行計畫

內容目錄
看得到用不到的 auto_explain
在 PostgreSQL 的設計中,使用 PL/pgSQL 寫的 stored procedure 與 user-defined function,是一種黑箱的設計機制。通常不易直接看到裡面的運作,需要透過 auto_explain 才能間接查看。
但一直以來,auto_explain 是一個看得到用不到的功能:
- 用 auto_explain 捕捉 stored function/procedure 裡面的 SQL 執行計畫,會紀錄在 DB log 裡面。不過,通常寫程式的人在公司裡不見得能夠直接登入 DB 主機查看資料庫 log。
- auto_explain 限定 superuser 使用
用 superuser 查看 stored procedure 內的執行計畫,其實不太實際,除了工作職責分離,在共用環境使用 superuser 可能會有誤觸的危險。
好在以上困難點在 EDB/PostgreSQL 15 開始妥善的得到解決~
EDB/PostgreSQL 15 改善 auto_explain 功能
在 EDB/PostgreSQL 15 開始,可以讓我們完整使用 auto_explain 功能~~
- 我們可以把 log 訊息往前端送:指定 client_min_message 參數,可以讓前端程式皆收到的 message 跟 DB log 一樣
- 在 PostgreSQL 15 多了允許指定帳號執行某些參數 set 的權限了~
在全資料庫指定 auto_explain.log_min_duration = -1 預設不自動抓,以免影響效能,需要時具備權限帳號的個別 session 自己指定 auto_explain.log_min_duration = 0。
還有其他的幾個參數,基本上就是 EXPLAIN 的各種參數的對應開關,顯示的東西會更細,這邊就不特別弄了。
這邊特別設定的是槽狀內容的執行計畫顯示,以便達到主要目標(查看 stored procedure 內容)。
[enterprisedb@edb15 ~]$ psql -d edb
Null display is "(NULL)".
Timing is on.
psql (15.6.0)
Type "help" for help.

[[local]] edb=# ALTER SYSTEM SET session_preload_libraries = '$libdir/auto_explain';
ALTER SYSTEM
Time: 21.323 ms
[[local]] edb=# select pg_reload_conf();
 pg_reload_conf
----------------
 t
(1 row)

Time: 0.293 ms
[[local]] edb=#
[[local]] edb=# ALTER SYSTEM SET auto_explain.log_min_duration = -1;
ALTER SYSTEM
Time: 34.568 ms
[[local]] edb=# ALTER SYSTEM SET auto_explain.log_analyze = true;
ALTER SYSTEM
Time: 32.499 ms
[[local]] edb=# ALTER SYSTEM SET auto_explain.log_nested_statements = true;
ALTER SYSTEM
Time: 23.925 ms
[[local]] edb=# select pg_reload_conf();
 pg_reload_conf
----------------
 t
(1 row)

Time: 0.580 ms
[[local]] edb=#
為了測試,這邊準備一支沒什麼用處的範例 stored function:裡面只是用三種方式呼叫 SQL
create or replace function test_debugger_explain()
returns void AS $xx$
declare
 testvar int := 3;
begin
 perform * from pg_stat_activity;
 select count(*) into testvar from pg_stat_activity;
 execute $$select * from pg_stat_activity$$;
end;
$xx$ language plpgsql;

[enterprisedb@edb15 ~]$ psql -d edb
Null display is "(NULL)".
Timing is on.
psql (15.6.0)
Type "help" for help.

[[local]] edb=# create or replace function test_debugger_explain()
returns void AS $xx$
declare
 testvar int := 3;
begin
 perform * from pg_stat_activity;
 select count(*) into testvar from pg_stat_activity;
 execute $$select * from pg_stat_activity$$;
end;
$xx$ language plpgsql;
CREATE FUNCTION
Time: 112.805 ms
[[local]] edb=# grant execute on function test_debugger_explain to aaa;
GRANT
Time: 10.309 ms
[[local]] edb=#
順便筆記一下,因為資安意識強化,在 PostgreSQL 15 開始,public schema 也不能讓隨意人放東西了
[[local]] edb=> create or replace function test_debugger_explain()
returns void AS $xx$
declare
 testvar int := 3;
begin
 perform * from pg_stat_activity;
 select count(*) into testvar from pg_stat_activity;
 execute $$select * from pg_stat_activity$$;
end;
$xx$ language plpgsql;
ERROR: permission denied for schema public
Time: 22.630 ms
[[local]] edb=>
啟用模組提供普通帳號執行:目標是讓普通帳號只要執行 set 即可立即啟用
但是!在預設狀況下,普通帳號不能跑這個 set
[[local]] edb=# \du
                                                     List of roles
       Role name       |                         Attributes                         |             Member of
-----------------------+------------------------------------------------------------+-----------------------------------
 aaa                   | Profile default                                            | {}
 aq_administrator_role | No inheritance, Cannot login                              +| {}
                       | Profile default                                            |
 enterprisedb          | Superuser, Create role, Create DB, Replication, Bypass RLS+| {}
                       | Profile default                                            |
 pemagent              | Profile default                                            | {pg_monitor,pg_read_all_settings}

[[local]] edb=#
[[local]] edb=# \c edb aaa
You are now connected to database "edb" as user "aaa".
[[local]] edb=> SET auto_explain.log_min_duration = 0;
ERROR:  permission denied to set parameter "auto_explain.log_min_duration"
Time: 10.797 ms
[[local]] edb=>
允許 non-superuser 操作,需要有在 PostgreSQL 15 可以對參數 GRANT SET ON PARAMETER 的功能。
[[local]] edb=# GRANT SET ON PARAMETER auto_explain.log_min_duration TO aaa ;
GRANT
Time: 26.979 ms
[[local]] edb=#
這樣就能順利讓普通帳號使用~另外為了 client_min_messages 要到 log 才行
[[local]] edb=# \c edb aaa
You are now connected to database "edb" as user "aaa".
[[local]] edb=> show auto_explain.log_level;
 auto_explain.log_level
------------------------
 log
(1 row)

Time: 0.192 ms
[[local]] edb=>
[[local]] edb=> SET auto_explain.log_min_duration = 0;
SET
Time: 0.365 ms
[[local]] edb=> SET client_min_messages TO log ;
SET
Time: 0.166 ms
[[local]] edb=>
[[local]] edb=> SELECT  test_debugger_explain();
LOG:  duration: 0.231 ms  plan:
Query Text: SELECT * from pg_stat_activity
Hash Left Join  (cost=2.36..3.91 rows=100 width=452) (actual time=0.207..0.220 rows=9 loops=1)
  Hash Cond: (s.usesysid = u.oid)
  ->  Hash Left Join  (cost=1.05..2.32 rows=100 width=388) (actual time=0.169..0.177 rows=9 loops=1)
        Hash Cond: (s.datid = d.oid)
        ->  Function Scan on pg_stat_get_activity s  (cost=0.00..1.00 rows=100 width=324) (actual time=0.118..0.119 rows=9 loops=1)
        ->  Hash  (cost=1.02..1.02 rows=2 width=68) (actual time=0.027..0.027 rows=4 loops=1)
              Buckets: 1024  Batches: 1  Memory Usage: 9kB
              ->  Seq Scan on pg_database d  (cost=0.00..1.02 rows=2 width=68) (actual time=0.013..0.014 rows=4 loops=1)
  ->  Hash  (cost=1.14..1.14 rows=14 width=68) (actual time=0.017..0.017 rows=16 loops=1)
        Buckets: 1024  Batches: 1  Memory Usage: 10kB
        ->  Seq Scan on pg_authid u  (cost=0.00..1.14 rows=14 width=68) (actual time=0.004..0.007 rows=16 loops=1)
LOG:  duration: 0.031 ms  plan:
Query Text: select count(*)              from pg_stat_activity
Aggregate  (cost=1.25..1.26 rows=1 width=8) (actual time=0.029..0.030 rows=1 loops=1)
  ->  Function Scan on pg_stat_get_activity s  (cost=0.00..1.00 rows=100 width=0) (actual time=0.023..0.024 rows=9 loops=1)
LOG:  duration: 0.102 ms  plan:
Query Text: select * from pg_stat_activity
Hash Left Join  (cost=2.36..3.91 rows=100 width=452) (actual time=0.079..0.092 rows=9 loops=1)
  Hash Cond: (s.usesysid = u.oid)
  ->  Hash Left Join  (cost=1.05..2.32 rows=100 width=388) (actual time=0.055..0.063 rows=9 loops=1)
        Hash Cond: (s.datid = d.oid)
        ->  Function Scan on pg_stat_get_activity s  (cost=0.00..1.00 rows=100 width=324) (actual time=0.024..0.026 rows=9 loops=1)
        ->  Hash  (cost=1.02..1.02 rows=2 width=68) (actual time=0.017..0.018 rows=4 loops=1)
              Buckets: 1024  Batches: 1  Memory Usage: 9kB
              ->  Seq Scan on pg_database d  (cost=0.00..1.02 rows=2 width=68) (actual time=0.009..0.010 rows=4 loops=1)
  ->  Hash  (cost=1.14..1.14 rows=14 width=68) (actual time=0.016..0.016 rows=16 loops=1)
        Buckets: 1024  Batches: 1  Memory Usage: 10kB
        ->  Seq Scan on pg_authid u  (cost=0.00..1.14 rows=14 width=68) (actual time=0.005..0.008 rows=16 loops=1)
LOG:  duration: 6.606 ms  plan:
Query Text: SELECT  test_debugger_explain();
Result  (cost=0.00..0.26 rows=1 width=4) (actual time=6.596..6.597 rows=1 loops=1)
 test_debugger_explain
-----------------------

(1 row)

Time: 8.366 ms
[[local]] edb=>
[test_edb15] edb=> EXPLAIN SELECT  test_debugger_explain();
LOG:  duration: 0.000 ms  plan:
Query Text: EXPLAIN SELECT  test_debugger_explain();
Result  (cost=0.00..0.26 rows=1 width=4)
                QUERY PLAN
------------------------------------------
 Result  (cost=0.00..0.26 rows=1 width=4)
(1 row)

Time: 14.875 ms
[test_edb15] edb=>
最後,到 DB Log 查看,也看得到一樣的結果~
[enterprisedb@edb15 ~]$ cat as15/data/log/edb-2024-03-31_000000.log
...前略
2024-03-31 14:06:05 UTC LOG: duration: 0.231 ms plan: Query Text: SELECT * from pg_stat_activity Hash Left Join (cost=2.36..3.91 rows=100 width=452) (actual time=0.207..0.220 rows=9 loops=1) Hash Cond: (s.usesysid = u.oid) -> Hash Left Join (cost=1.05..2.32 rows=100 width=388) (actual time=0.169..0.177 rows=9 loops=1) Hash Cond: (s.datid = d.oid) -> Function Scan on pg_stat_get_activity s (cost=0.00..1.00 rows=100 width=324) (actual time=0.118..0.119 rows=9 loops=1) -> Hash (cost=1.02..1.02 rows=2 width=68) (actual time=0.027..0.027 rows=4 loops=1) Buckets: 1024 Batches: 1 Memory Usage: 9kB -> Seq Scan on pg_database d (cost=0.00..1.02 rows=2 width=68) (actual time=0.013..0.014 rows=4 loops=1) -> Hash (cost=1.14..1.14 rows=14 width=68) (actual time=0.017..0.017 rows=16 loops=1) Buckets: 1024 Batches: 1 Memory Usage: 10kB -> Seq Scan on pg_authid u (cost=0.00..1.14 rows=14 width=68) (actual time=0.004..0.007 rows=16 loops=1)
2024-03-31 14:06:05 UTC CONTEXT: SQL statement "SELECT * from pg_stat_activity"
PL/pgSQL function test_debugger_explain() line 5 at PERFORM
2024-03-31 14:06:05 UTC LOG: duration: 0.031 ms plan:
Query Text: select count(*) from pg_stat_activity
Aggregate (cost=1.25..1.26 rows=1 width=8) (actual time=0.029..0.030 rows=1 loops=1)
-> Function Scan on pg_stat_get_activity s (cost=0.00..1.00 rows=100 width=0) (actual time=0.023..0.024 rows=9 loops=1)
2024-03-31 14:06:05 UTC CONTEXT: SQL statement "select count(*) from pg_stat_activity"
PL/pgSQL function test_debugger_explain() line 6 at SQL statement
2024-03-31 14:06:05 UTC LOG: duration: 0.102 ms plan:
Query Text: select * from pg_stat_activity
Hash Left Join (cost=2.36..3.91 rows=100 width=452) (actual time=0.079..0.092 rows=9 loops=1)
Hash Cond: (s.usesysid = u.oid)
-> Hash Left Join (cost=1.05..2.32 rows=100 width=388) (actual time=0.055..0.063 rows=9 loops=1)
Hash Cond: (s.datid = d.oid)
-> Function Scan on pg_stat_get_activity s (cost=0.00..1.00 rows=100 width=324) (actual time=0.024..0.026 rows=9 loops=1)
-> Hash (cost=1.02..1.02 rows=2 width=68) (actual time=0.017..0.018 rows=4 loops=1)
Buckets: 1024 Batches: 1 Memory Usage: 9kB
-> Seq Scan on pg_database d (cost=0.00..1.02 rows=2 width=68) (actual time=0.009..0.010 rows=4 loops=1)
-> Hash (cost=1.14..1.14 rows=14 width=68) (actual time=0.016..0.016 rows=16 loops=1)
Buckets: 1024 Batches: 1 Memory Usage: 10kB
-> Seq Scan on pg_authid u (cost=0.00..1.14 rows=14 width=68) (actual time=0.005..0.008 rows=16 loops=1)
2024-03-31 14:06:05 UTC CONTEXT: SQL statement "select * from pg_stat_activity"
PL/pgSQL function test_debugger_explain() line 7 at EXECUTE
2024-03-31 14:06:05 UTC LOG: duration: 6.606 ms plan:
Query Text: SELECT test_debugger_explain();
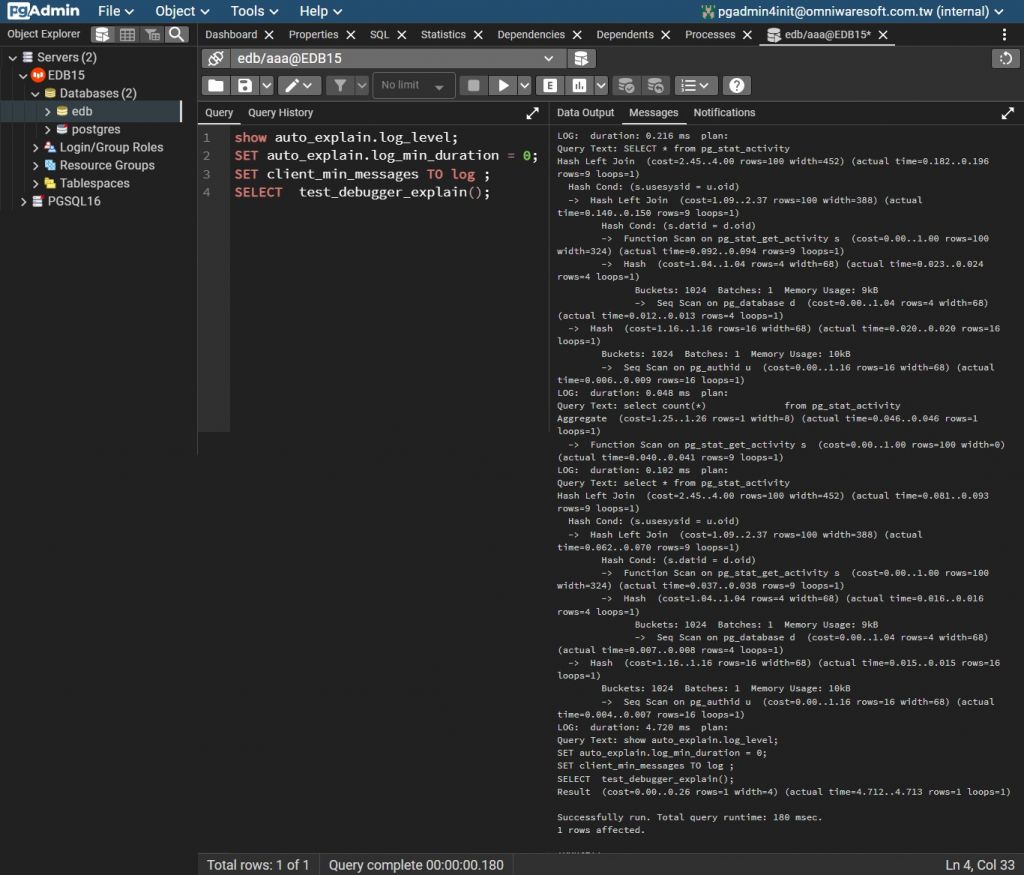
Result (cost=0.00..0.26 rows=1 width=4) (actual time=6.596..6.597 rows=1 loops=1)有了以上的用法,就可以在圖形化連線工具中正常使用用普通帳號使用 auto_explain 了~
以下為一個範例,在 pgAdmin4 v5.2 上的測試(黑色模式喔~)
參考資料
- Debugger — pgAdmin 4 documentation
- PGDebugger – DBeaver Documentation
- PL/pgSQL tracing/execution plan [closed] – postgresql
- How to optimize the performance of a stored procedure in Postgres? – Stack Overflow
- EXPLAIN ANALYZE shows no details for queries inside a plpgsql function – Database Administrators Stack Exchange
- How do I log/trace Oracle stored procedure calls with parameter values? – Stack Overflow
- PostgreSQL 15: More flexibility with setting parameters – dbi Blog
- pg_parameter_acl – pgPedia – a PostgreSQL Encyclopedia
- has_parameter_privilege() – pgPedia – a PostgreSQL Encyclopedia
- auto_explain – pgPedia – a PostgreSQL Encyclopedia
- DBMS_APPLICATION_INFO: Database PL/SQL Packages and Types Reference – Oracle Database Online Documentation 12c Release 1 (12.1)
- DBMS_TRACE: Database PL/SQL Packages and Types Reference – Oracle Database Online Documentation 12c Release 1 (12.1)